Beginner Buffer Overflows Visualised
A Visual Guide to how a simple Buffer Overflow Attack works
Many people who perform buffer overflows, be it when learning, or when they have already passed the OSCP don’t quite fully understand how it works. Yes, in it’s simplest form, it can be exploited by performing a fixed set of commands and procedures. You can literally watch someone do it once, and with a whole lot of copy and paste, replicate the attack without knowing what it does.
Sometimes, you find that your copy and paste commands don’t work. This will cause panic, especially during things such as the OSCP exam. For this purpose, I have prepared a simple illustration of what each step of your attack is doing.
This is a simplified version of what is happening, and may not 100% accurately reflect what is going on, but you’ll at least get a clearer idea of what is happening at each stage of your attack. I assume at this point, you have performed buffer overflows before, or at least watched some tutorial on it. You might have landed here somehow, because it looks complicated at first and have no idea what you’re doing..
This is not a Buffer Overflow Guide, but rather a visualisation to complement any practice or learning you may be doing.
How it works
1. Finding the buffer size
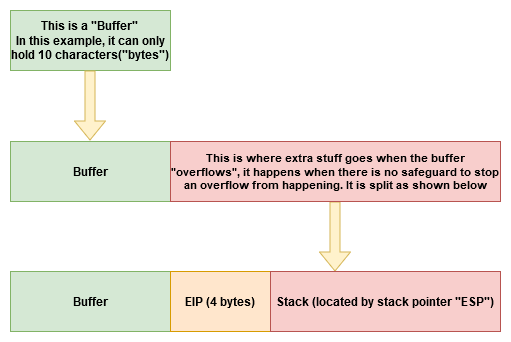
When an application takes an input, it gets put into the application’s memory like this:

But at this stage, we don’t know how big the buffer is, how do we find out?
If we throw a unique string in it, where no sequence of 4 characters appear twice, we can identify it. With msfvenom, you can generate unique strings of several thousand lines long where no sequence of 4 characters will appear twice.
But for this example, lets say we throw 26 characters of the alphabet at it:
ABCDEFGHIJKLMNOPQRSTUVWXYZ
It will get filled and look something like this:

After we inject our alphabet, we can see that the EIP contains KLMN. We know that KLMN appears at offset 10 in the unique string, so the buffer should be 10! To confirm this, we put our own crafted string inside. We start with 10 A’s. followed by 4 B’s, and fill the rest with C’s
AAAAAAAAAABBBBCCCCCCCCCCCC
In hex representation, A is 41, B is 42, and C is 43. So in theory, it will look like this:

Bad Characters
There is a catch! Sometimes things don’t go as smoothly as you’d like. There might be some restricted characters which are not accepted by the application(aka “Bad Characters”). To find them out, we place every possible character in stack and check it out
AAAAAAAAAABBBB <then every possible character here>

Inside a debugger, we look at the stack see that D and 2 were corrupted and replaced with something else…. so we know these are the bad characters, so we should exclude them when creating our shellcode.

JMP ESP?
Now you need to know what the registers actually do and mean. A simplified explanation is:
- EIP (Instruction Pointer) - Basically means where do I go next?
- ESP (Stack Pointer) - This is the Location of where all our C’s were in a previous step
We then find out where we can find an instruction that says JMP ESP, which basically means JuMP to ESP. For example, we find a JMP ESP at location 1234.

So, your final payload will look like this:
AAAAAAAAAA<JMP ESP location><shellcode>

And that, folks, is a rough idea of how your basic buffer overflows work.
Cheers!
J